Software
Generating transects using R-Package ‘atm’
Kevin Stierhoff provided us with R-code from the ‘atm’ package used to generate a transect grid for the 2024 CalCurCEAS survey. These transects were then incorporated into CalTopo for planning and to track cruise progress. The package files are also included on the SWFSC-CMAP Lab Manual Github site in the code folder.
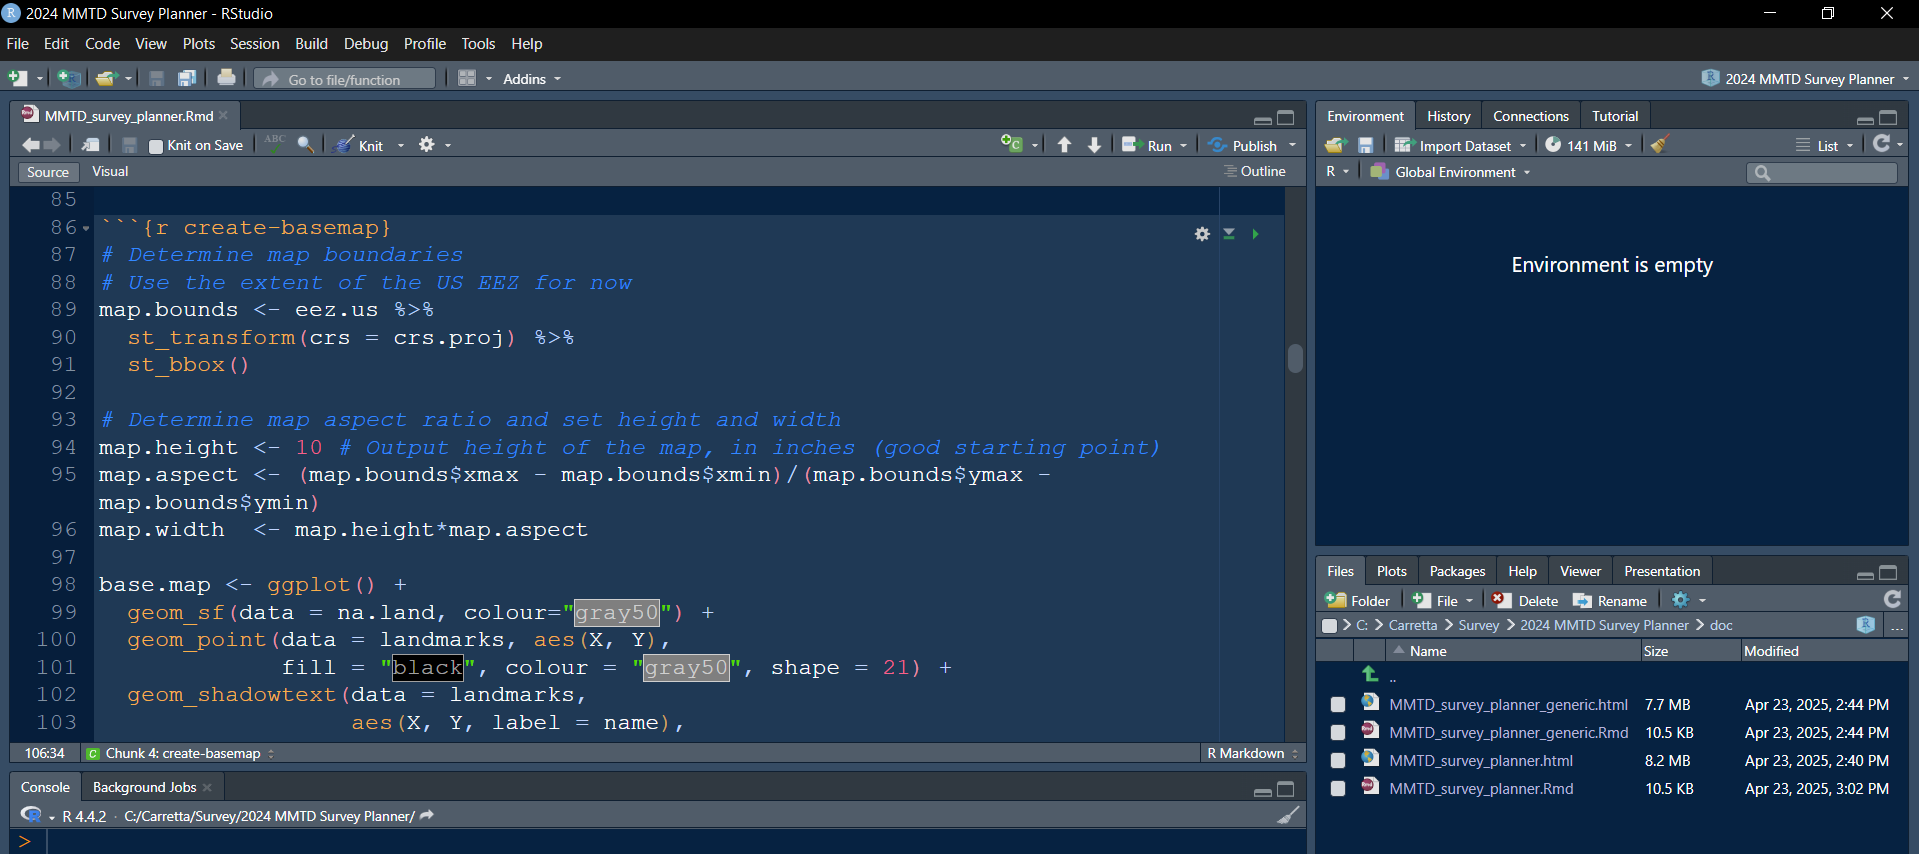
Open the MMTD Survey Planner R-Project in RStudio
Go to the ‘doc’ folder, open the MMTD_Survey_Planner.RMD file. Learn the code, make adjustments to transect spacing, and ‘knit’ the file to create transect lines.
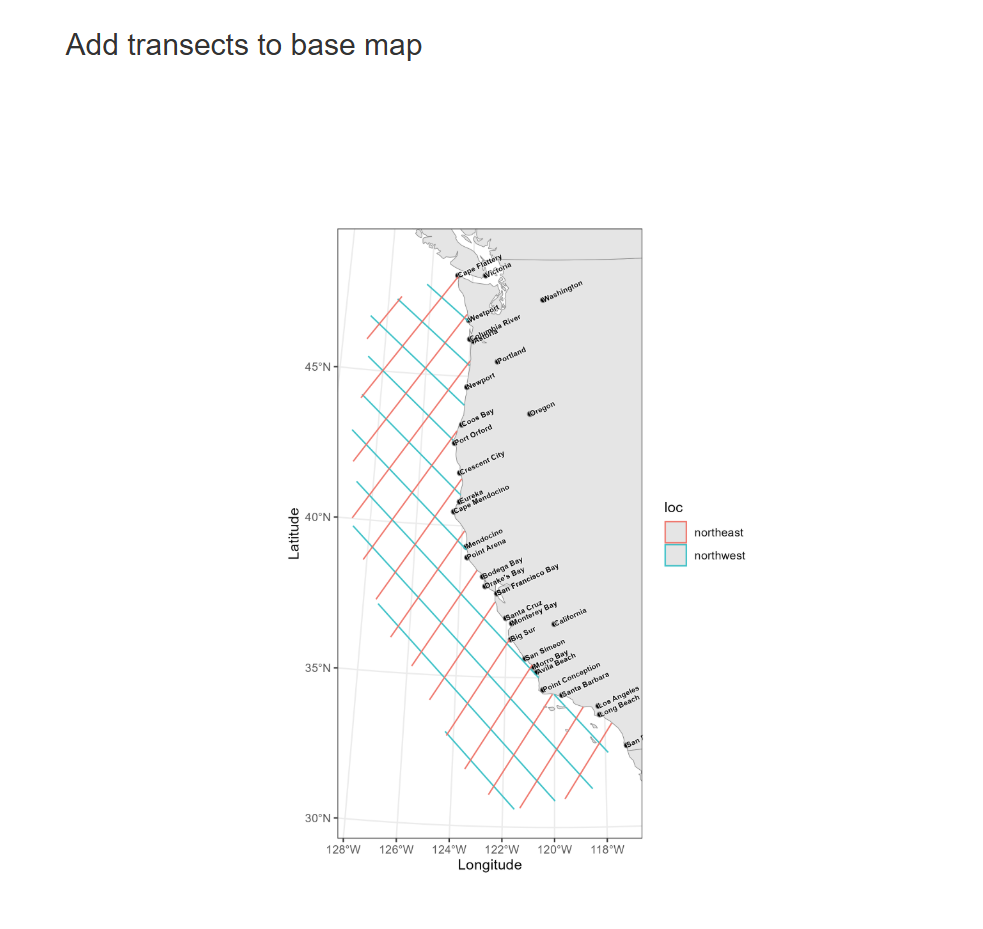
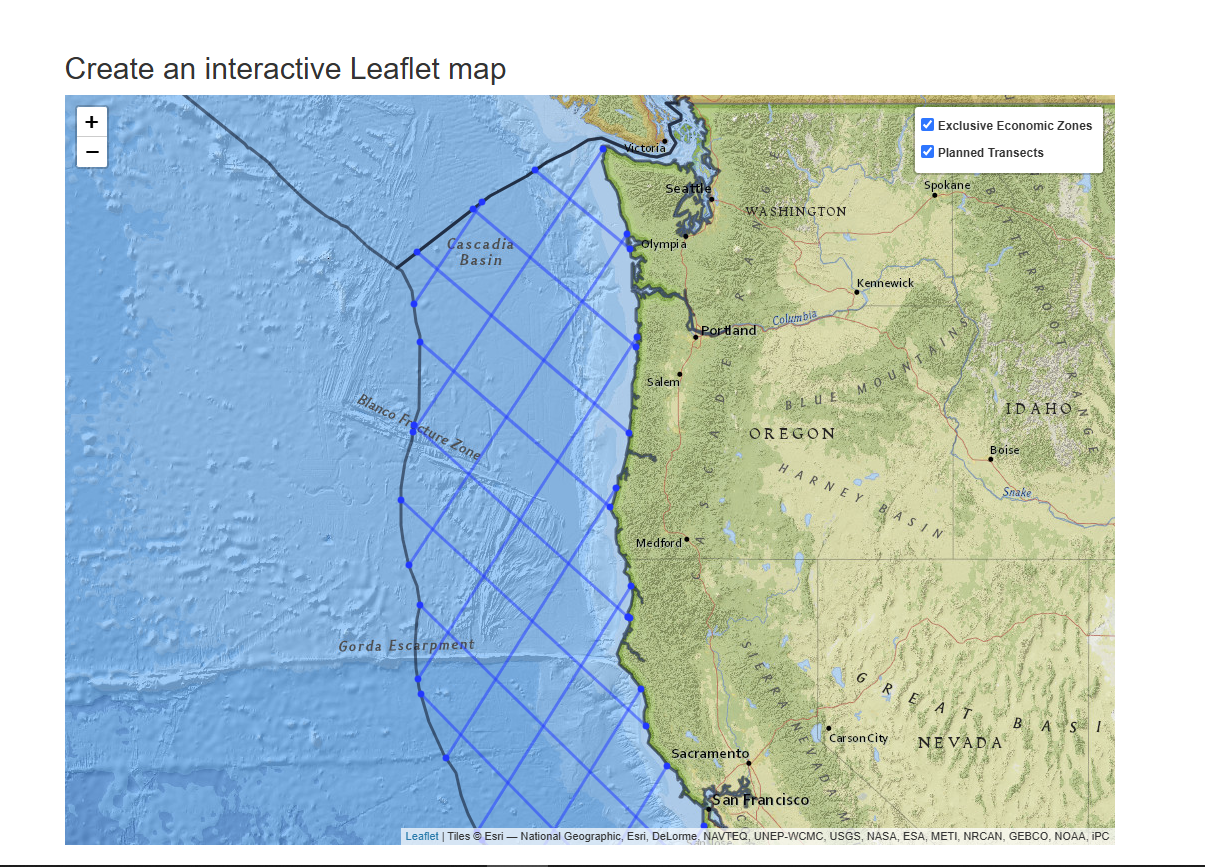
The R-markdown file will generate a series of plots, corresponding to sections of the code: 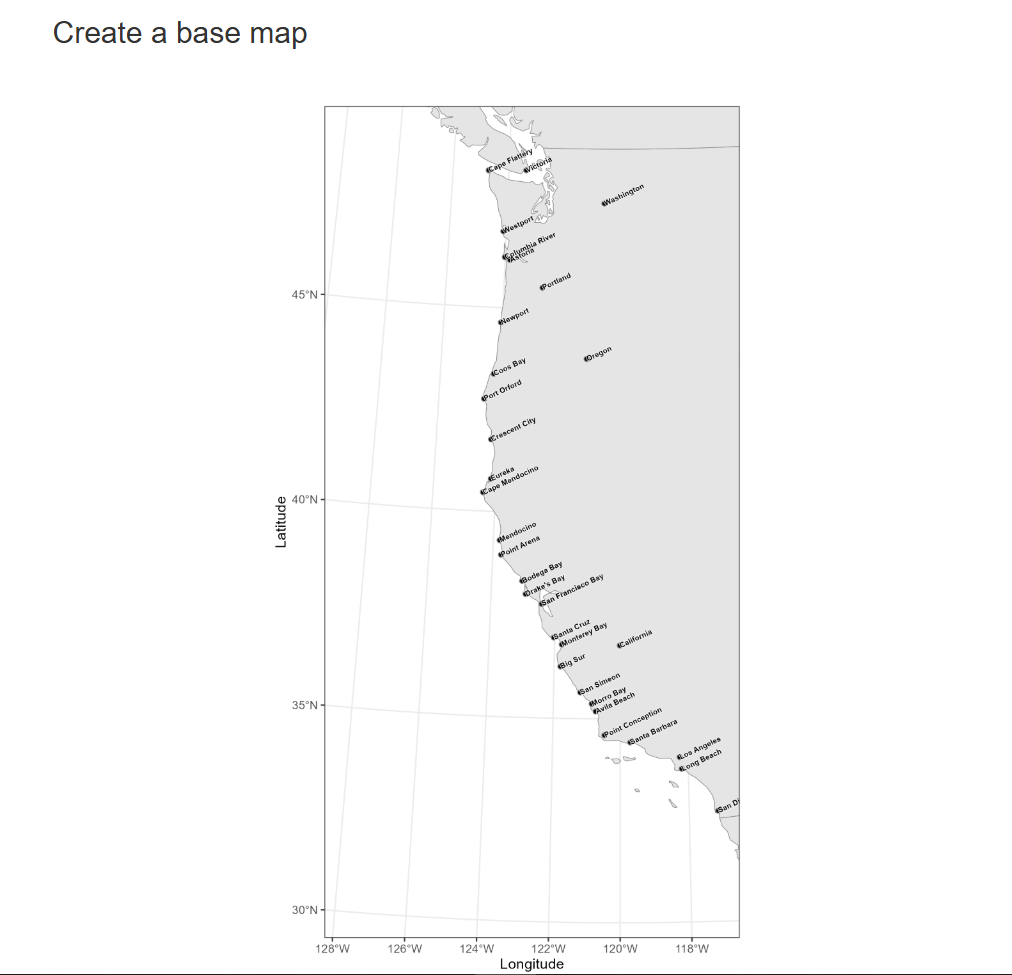
including an interactive Leaflet map:
Knitting the document also produces a CSV file (waypoints_final.csv) with transect points: 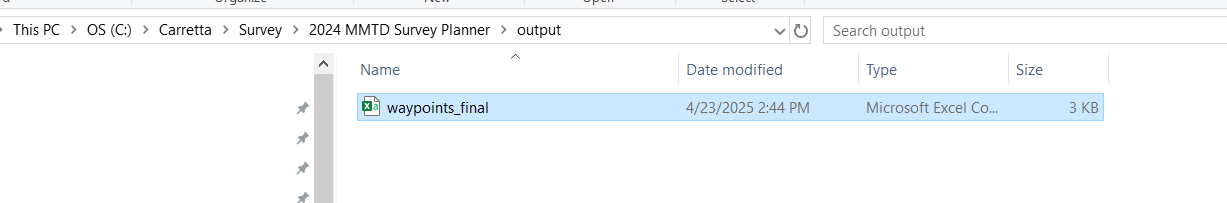
which looks like this:
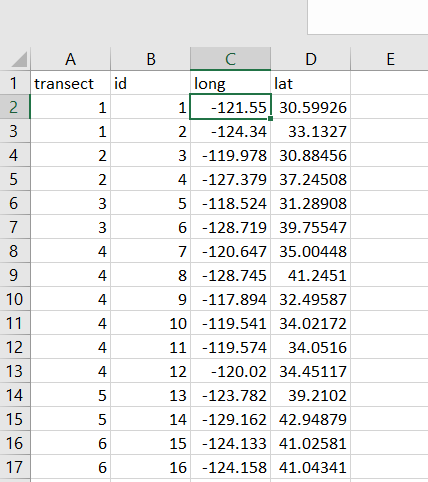
Individual transects may contain more than 2 points, as new segments are generated when a transect crosses a land or island boundary.
In R, there are many ways to convert Excel or CSV files to shapefiles, JSON, or GPX format. You will need to become familiar with spatial object formats, maybe rely on AI a little for example code. To generate shapefiles and JSON format from a data frame of transect points, use the R script Linestrings_Points_Shapefiles_from_df.R.
Mapping and Summarizing line-transect survey DAS data
Our research cruises utilize the software VisCruz to collect data in the data acquisition system? (DAS) format. DAS data can be error-checked, processed, and tabulated using Sam Woodman’s R-Package swfscDAS
The swfscDAS package is intended to standardize and streamline basic DAS data processing. Functionality currently includes reading DAS data into a data frame, processing this data (extracting state and condition information for each DAS event), and summarizing sighting, effort, and comment information. Learn more in vignette(“swfscDAS”)
Effort and Sighting Maps can be generated using the R-package CruzPlot. CruzPlot contains a GUI for creating maps, plotting data, and performing basic data summaries from data files in the “DAS” format, produced by the SWFSC software WinCruz and VisCruz. Fancier JPG maps for Marine Mammal Stock Assessments (U.S. West Coast only) can be generated using the R-script Plot_DAS Effort_and_Sightings_Data_SARS.R
Another useful script interacts with the R-Package swfscDAS and a DAS file to produce a tabular, CSV format summary of all sightings data: “get_Sightings_swfscDAS.R” This script is in the “c:/carretta/cruise_1652/R_utilities” directory. You can also just read the swfscDAS documentation to do the same thing.
PAM Software
Link to Software developed by Soutwest Acoustic Ecology Lab
ObsCovgTools
The ObsCovgTools R package is discussed under Risk Assessment.
ApportionMnStocks
The ApportionMnStocks R package is discussed under Projects/Mn Stock Proportions.
SeriousInjury
The SeriousInjury R package is discussed under Human-Caused Mortality.